Reports for Trello
Visualize your Trello cards as professional charts and real-time dashboards. Track progress, spot bottlenecks, and make data-driven decisions.

What is Reports (by Placker)?
Reports turns your Trello cards into interactive charts and dashboards. Track team progress, spot bottlenecks, and make data-driven decisions, all in real-time. Create custom widgets, schedule automatic reporting, and view data from multiple boards in one place.
✨ Key Features
- Track progress with real-time dashboards
- Turn Trello data into clear charts and insights
- Spot bottlenecks and workload issues early
- Make data-driven decisions with real numbers
- Automate email reports to save time
- View data from multiple boards in one place
👥 Perfect For
- Project managers tracking team progress
- Team leads reporting to stakeholders
- Operations teams monitoring workflows
- Executives viewing performance metrics
- Agency teams reporting to clients
- Scrum masters tracking sprint metrics
Start with a 15-day free trial. Get started in minutes. No credit card required.
Trusted by teams worldwide
See what our customers have to say
"I love how visual and easy to understand the statistics are. Getting the insights I need is simpler than ever."
"Thank you for this amazing tool, it has already improved the way we track and execute big complex projects."
"So far I am loving it! Will make our morning huddles much more focused now"
"The product is awesome. Your dashboard is very good."
"The best part of Placker for me is that it's become part of my morning routine. I wake up, work out, meditate, and then pull up Placker along with Trello to plan my day. The latter used to consist of me trying to recall all of tasks I had to accomplish and making a physical list for the day. Now, I get a snapshot, and I can adjust my plan easily well before my workday begins. I also really like being able to measure the workload of my people so that they don't get overwhelmed without a specific reason."
"It was the best solution I could find for us to be able to measure if cards were completed on time. The dashboards are great."
"I'm really enjoying using the tool, the tracker is perfect to get an overview when I need to provide answers."
"This is one of the best addons I have found. Thanks!"
Live Analytics
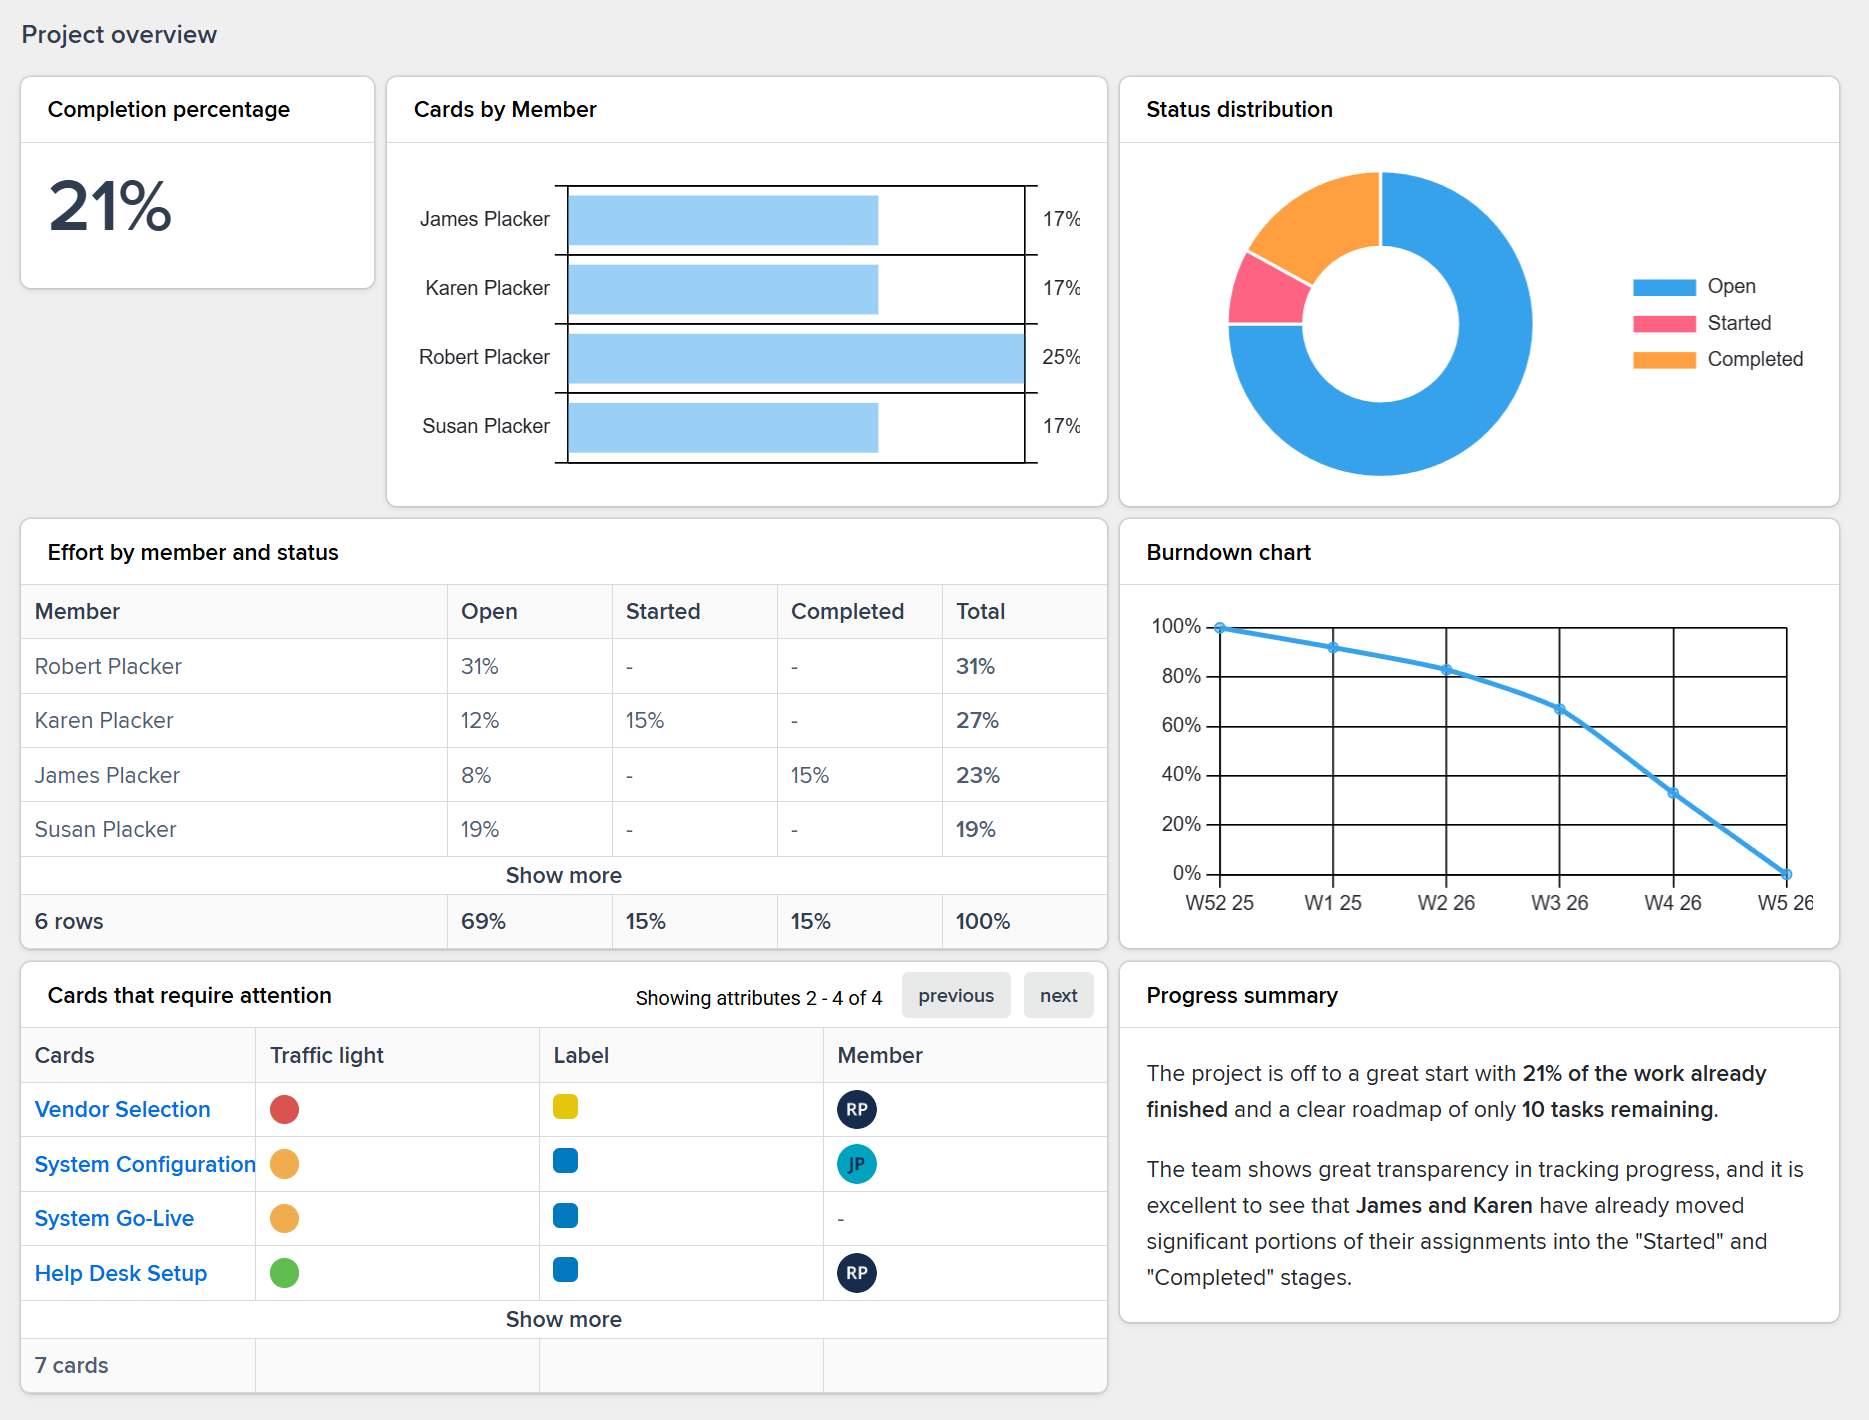
Real-Time Dashboards
See your team's progress at a glance with customizable dashboards that update automatically from board activity in Trello.
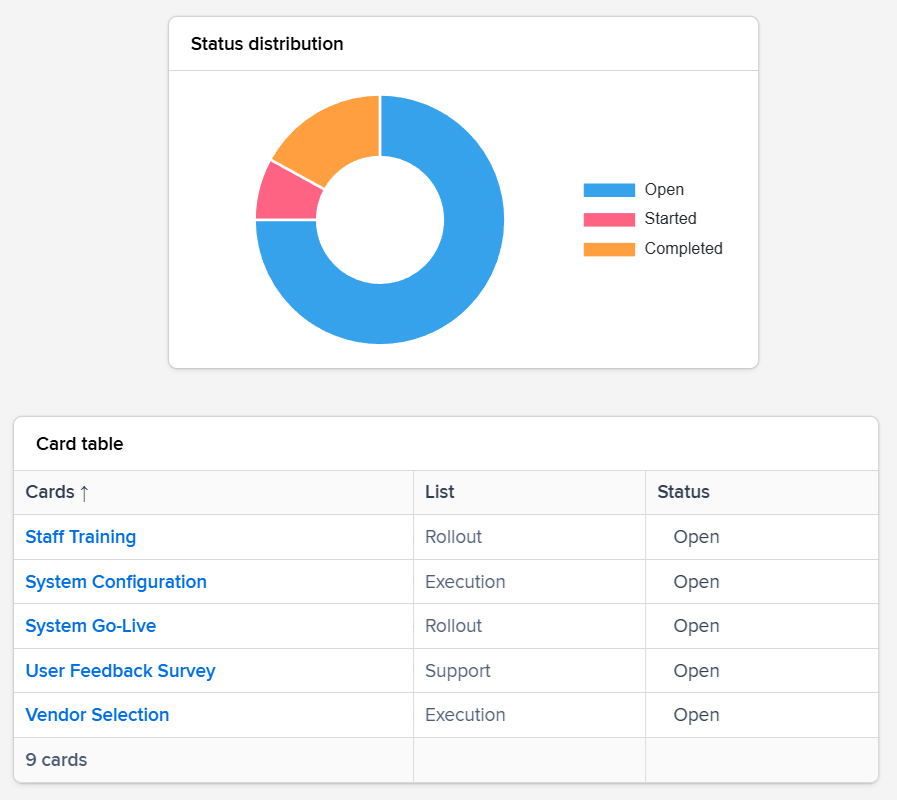
- See what matters most with custom widgets
- Build dashboards with exactly the metrics you need. Choose from charts, tables, counters, and progress bars to track what's important to your team.
- Updates happen automatically as work progresses
- No manual refresh needed. Your dashboards update in real-time as cards move, labels change, or due dates approach.
- Share live views with stakeholders instantly
- Give anyone access to up-to-date progress without granting Trello access. Perfect for clients, executives, or external partners.
Smart Analysis
Data Insights
Transform raw card data into actionable insights. Spot patterns, identify risks, and make informed decisions backed by real numbers.
- Identify problems before they escalate
- Spot overloaded team members, approaching deadlines, and stuck cards at a glance. Address issues while they're still manageable.
- Compare performance across projects
- See which projects are on track and which need attention. Compare cycle times, completion rates, and workload distribution.
- Back decisions with actual data
- Move beyond gut feelings. Use real metrics to justify resource allocation, prioritize work, and set realistic timelines.
Time Savers
Automated Reporting
Set up reports once and let them run automatically. Schedule automated reports to clients and teams, combine multiple boards, and stop building manual spreadsheets.
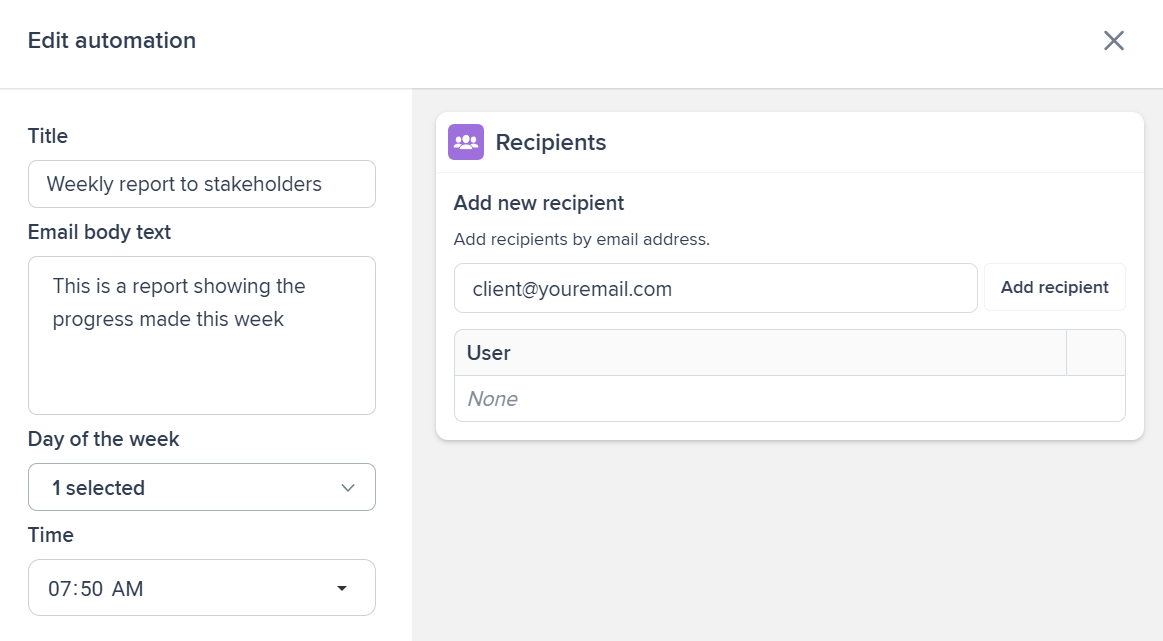
- Email reports run on your schedule
- Set up weekly status reports, daily digests, or custom schedules. Stakeholders get updates automatically without you lifting a finger.
- Combine data from multiple boards
- Create portfolio-level reports that pull from all your Trello boards. See the big picture without switching between boards.
- Stop compiling status reports manually
- Reclaim hours every week. Your reports generate themselves from live Trello data, always accurate and always current.
Ready to supercharge your Trello boards?
Start your 15-day free trial today. No credit card required.