A Gantt chart where moving one task moves the rest
Placker turns your tasks and their dates into a Gantt chart you can plan against. Drag a bar to move a task, link tasks to set the order they run in, and the schedule recalculates. One timeline carries the whole project, from the first task to the final milestone.
Resumo rápido
Gantt Chart in Placker
A live timeline that keeps itself current as your project moves:
- Shift one task, the rest follow. Auto-scheduling recalculates start and end dates from your dependencies, so the timeline reflects where the project actually stands.
- See what sets your finish date. The critical path highlights the tasks that determine your earliest possible finish.
- Spot overload before it happens. The resource planner shows each member's hourly workload right alongside the Gantt bars.
- Share it the way you see it. Send a live view or export to PDF and PNG with your grouping and filters intact.
- In every plan and Power-Up. Auto-scheduling ships across every plan and Power-Up, so the timeline works wherever you do.
Agendamento automático
Gantt chart software that keeps your schedule up to date
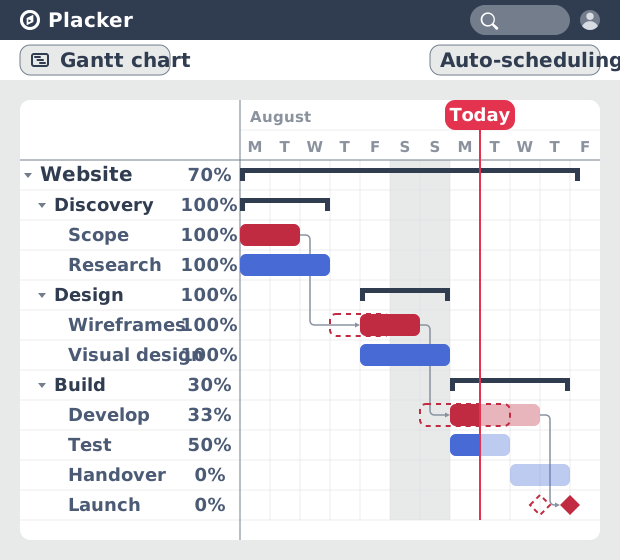
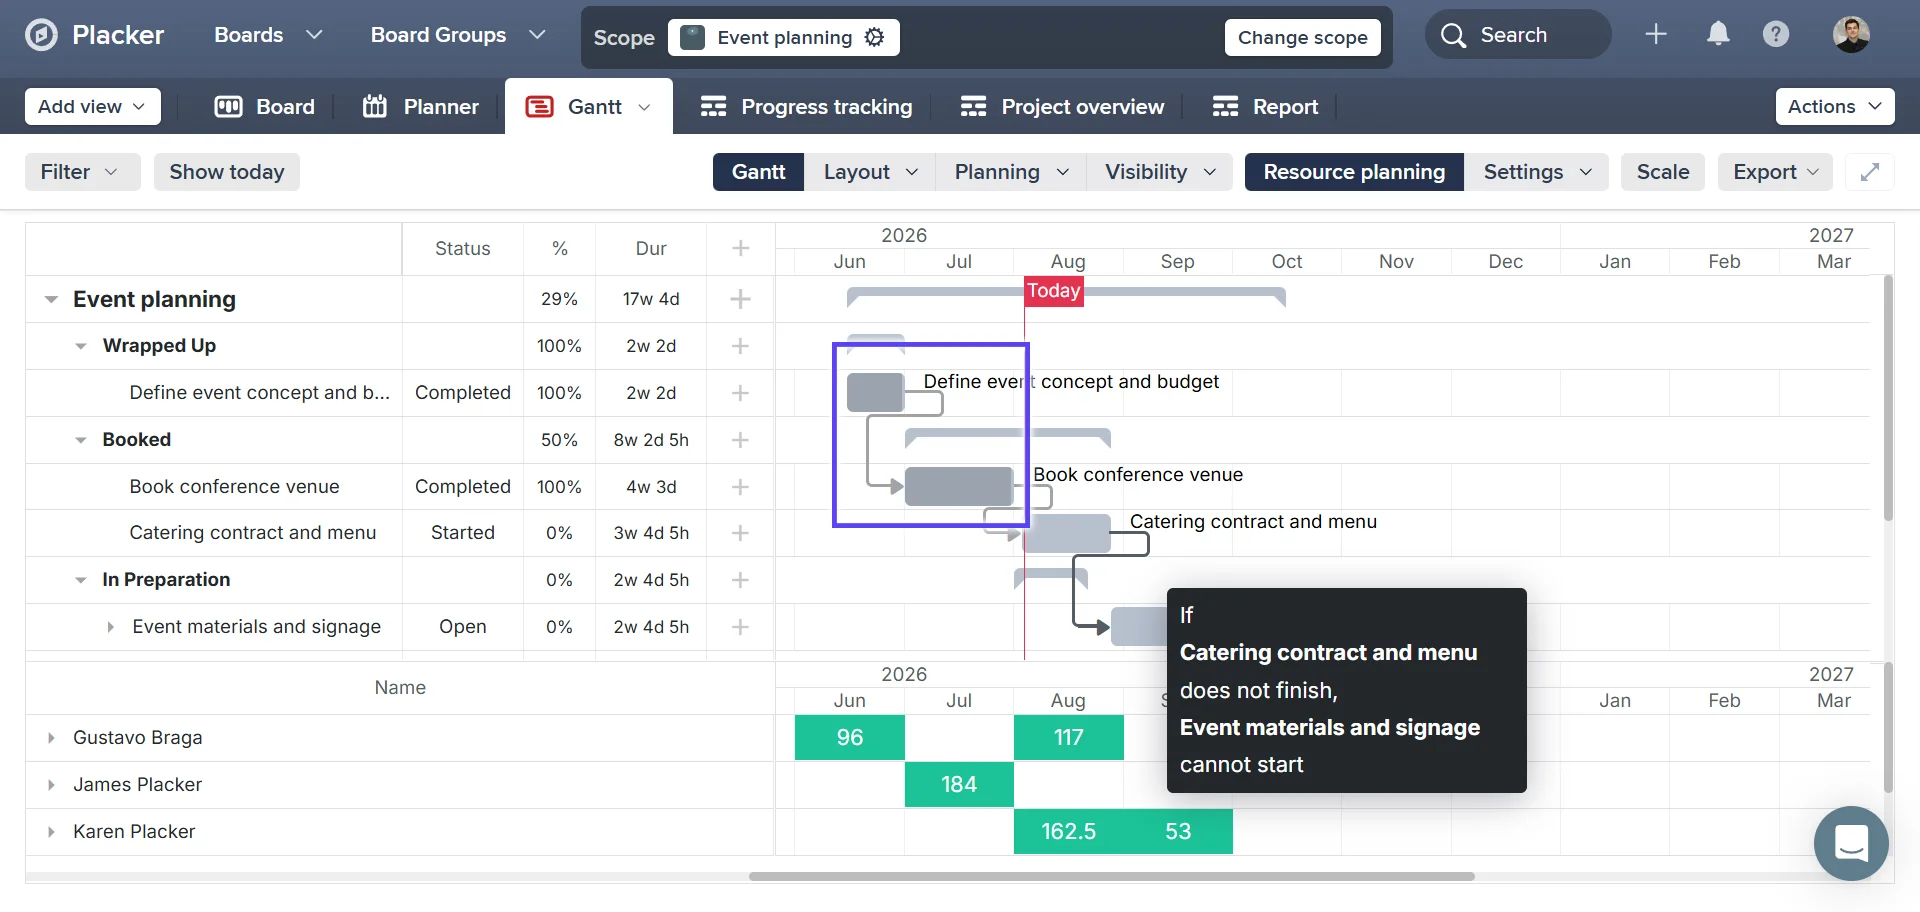
Each task lands on the timeline as a bar, drawn from its start and end dates. You create a dependency by dragging the circle next to a bar onto the task that follows it, so a task starts only after the one before it finishes.
When you move a date or a predecessor slips, auto-scheduling shifts the dependent tasks for you instead of leaving you to drag each one by hand. On a plan with dozens of linked tasks that keeps the finish date honest, and it removes the manual rework that makes most teams quietly stop updating the chart.
Critical path
See what protects the deadline, and what threatens it
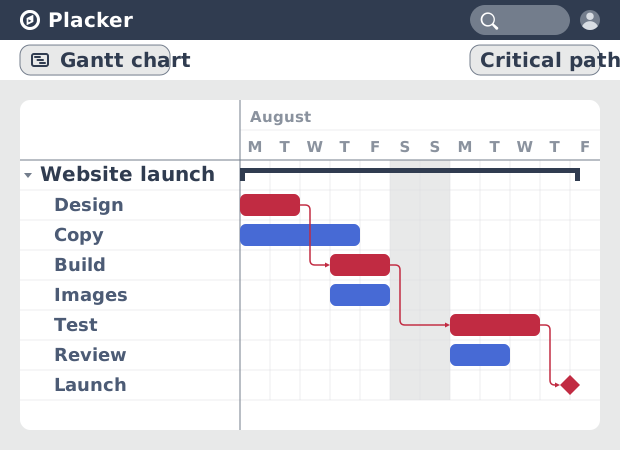
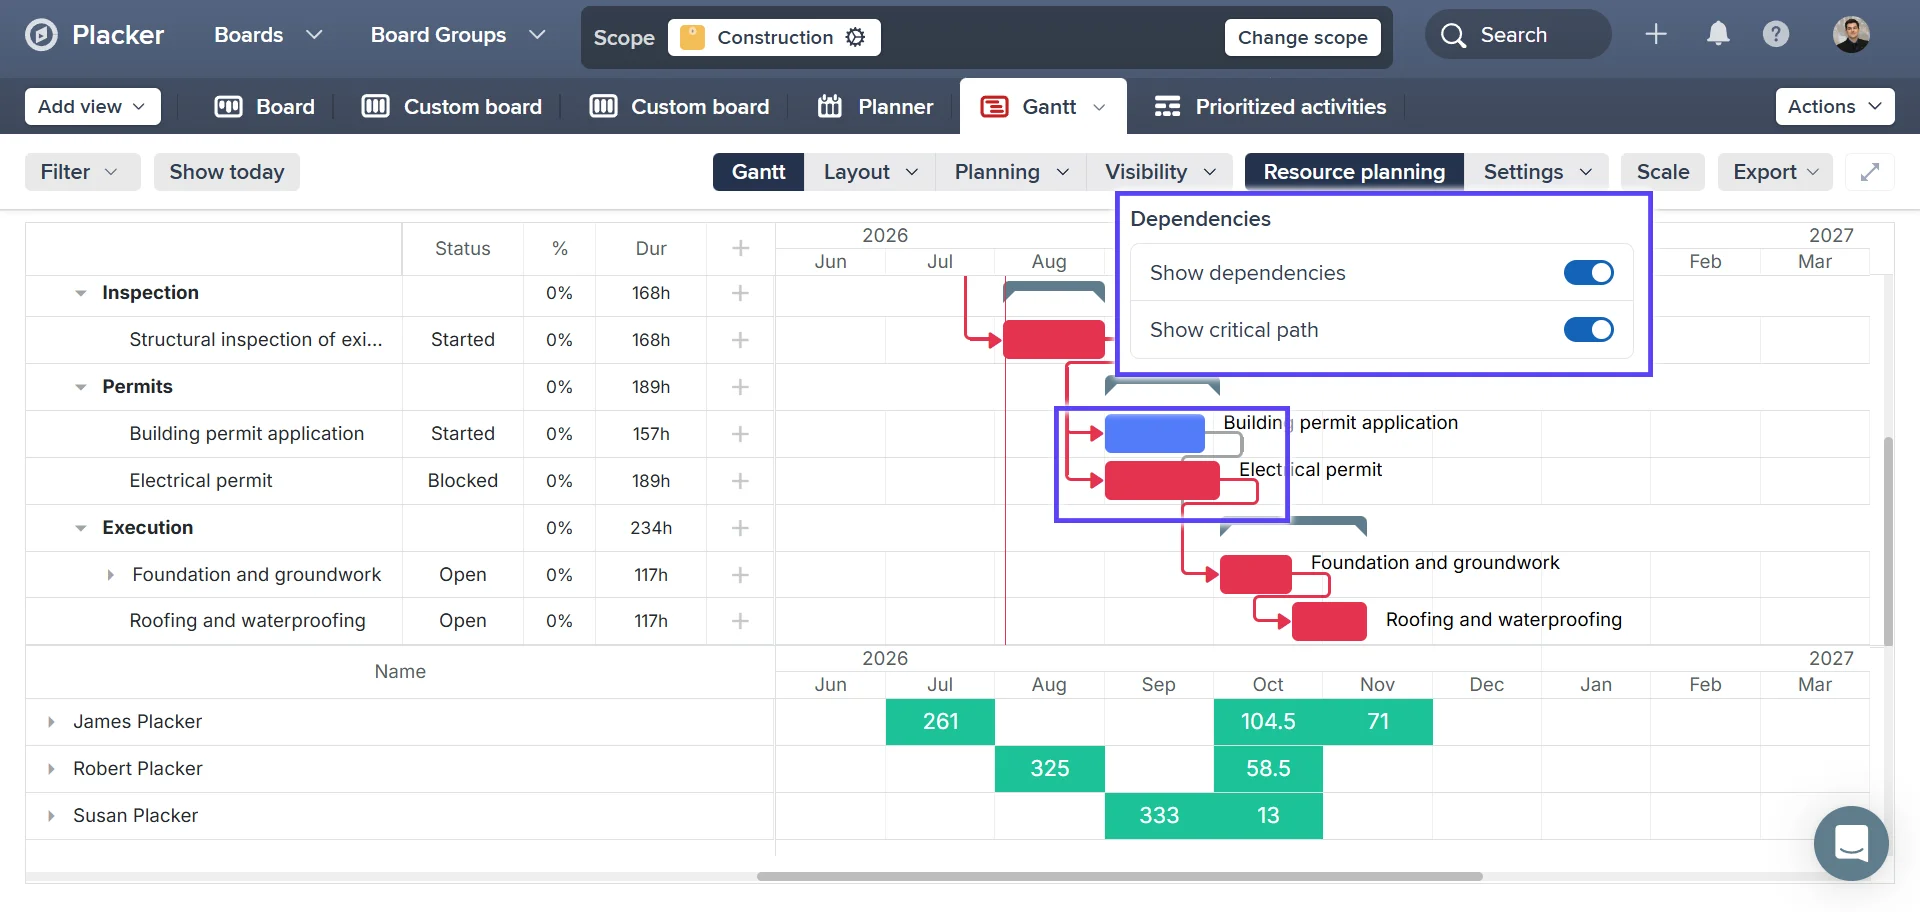
With the dates staying current, the next question is which of them actually control the finish. Turn on the critical path from the Visibility menu to mark the chain of tasks that decides the earliest the project can finish. Set a baseline and it snapshots the current plan, so you can compare it against where the work stands later. A card you mark Started records its actual start date, and Completed records the actual end.
The critical path tells you which tasks have no slack; the baseline shows the plan against the actual at a glance. You spend your attention on the tasks that move the end date, and you catch a slip while there is still time to do something about it.
Resource planning
Plan the team and the portfolio, not just one project
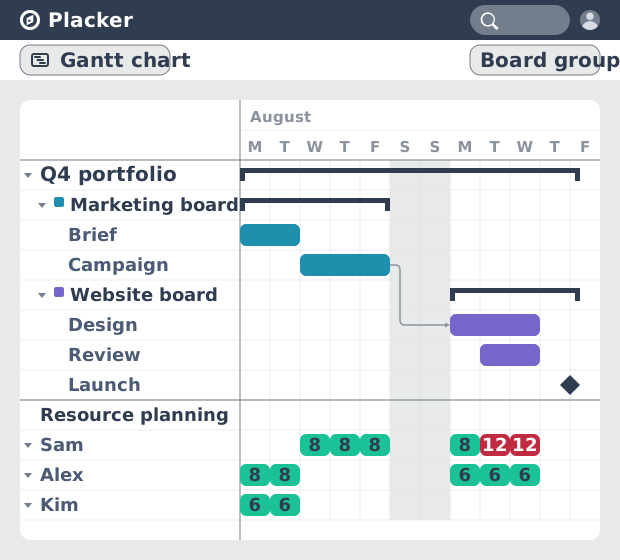
Doing something about that slip usually means finding capacity, and it rarely sits inside one project. The resource planner puts each person's hourly workload on the timeline next to their tasks, so an overloaded week is visible while you can still rebalance it. Scope brings several boards into one Gantt view, and Board Groups place tasks from multiple boards on a single timeline.
Capacity and cross-project dependencies live in the same place as the schedule. You commit to dates the team can actually meet, and you plan a dependency that runs across two projects without exporting anything to a spreadsheet.
Como funciona
Four steps take a list of dated tasks and turn it into a Gantt chart that keeps itself current.
- 1
Add dates to your tasks
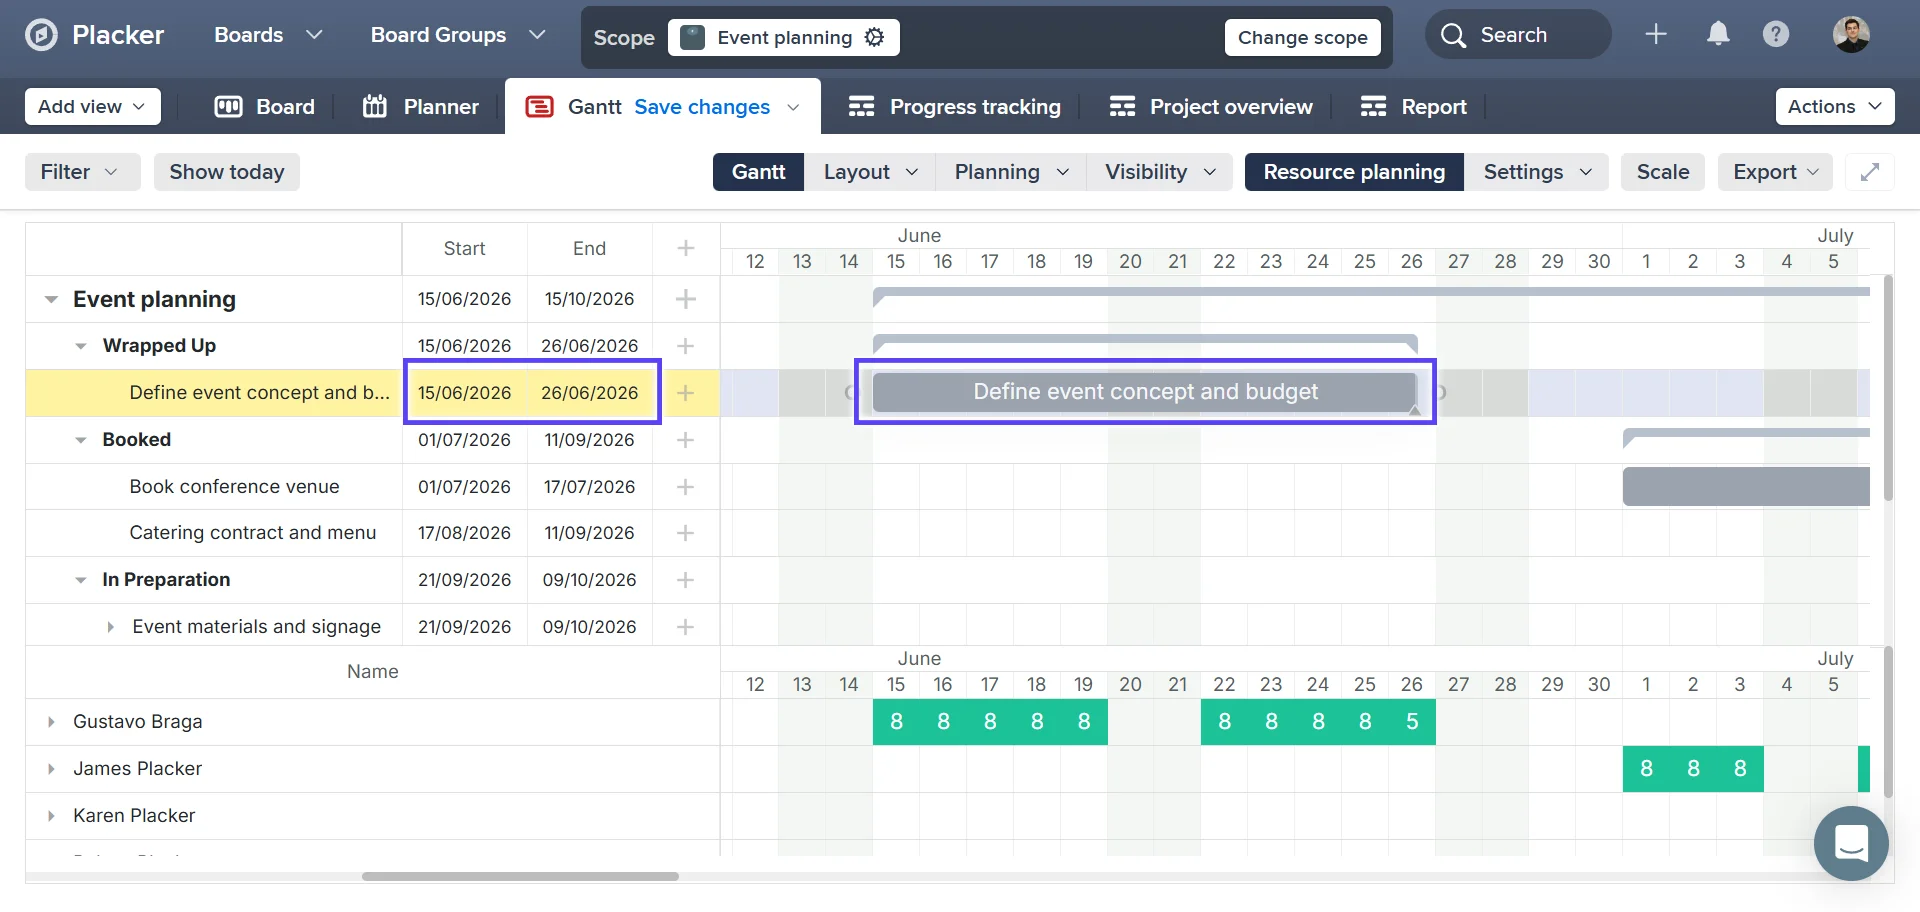
Give each task a start and end date. Every task that has dates renders as a bar on the timeline, placed by when it runs and sized by how long it takes. Duration counts your work days, hours, and holidays from the board calendar.
- 2
Link tasks to set their order
Drag the circle beside a task bar onto the task that should follow it. The link sets a predecessor and a successor, so the second task starts after the first one finishes.
- 3
Turn on auto-scheduling and the critical path
Switch on auto-scheduling so the dates recalculate whenever a task moves. Then choose Show critical path from the Visibility menu to mark the tasks that drive the finish date.
- 4
Group, filter, and share the view
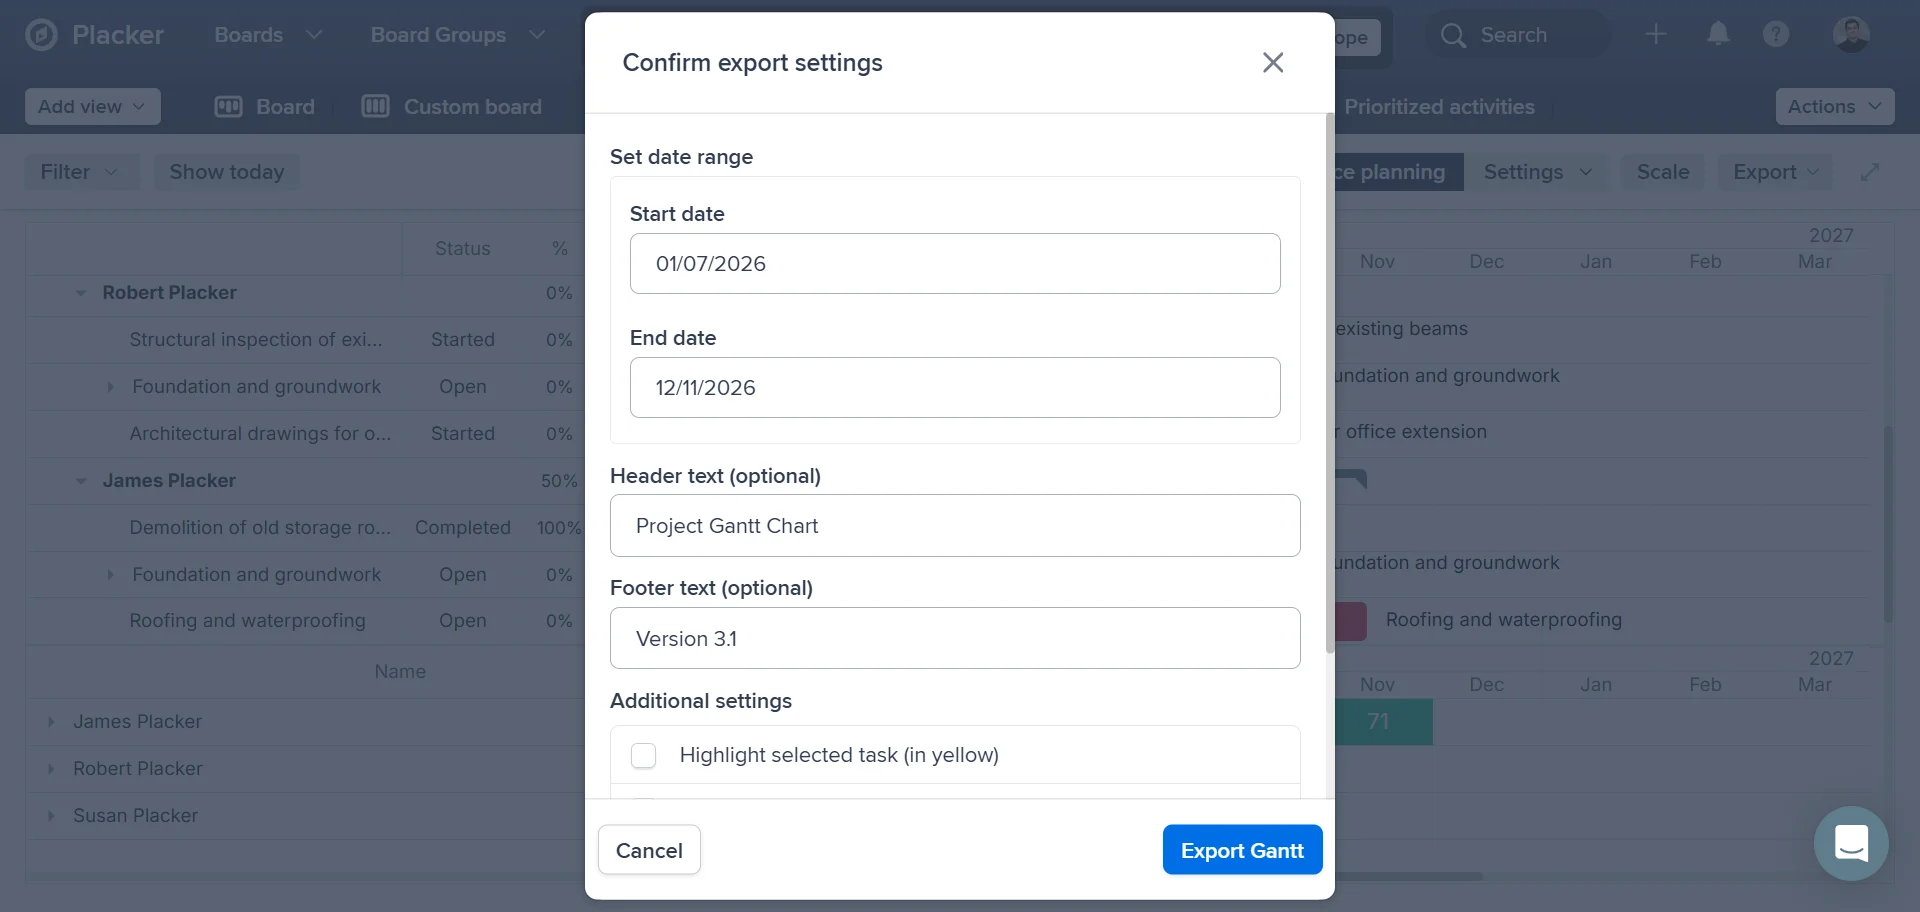
Group bars by list, label, or member, and filter to the tasks you need. Open separate Gantt tabs with their own layouts, then share the live view with your team or export it to PDF or PNG.
Casos de uso
Common scenarios for teams that run Placker as their primary project management tool.
Agency delivery lead juggling client deadlines
You run several client projects at once, each with a hard delivery date. You build each project as tasks with dependencies, switch on auto-scheduling, and keep the critical path in view. When a client delays feedback, you can see at once which deliverables move and tell the client what the delay costs the timeline.
Professional services team planning billable work
Your consultants are booked across overlapping engagements. You use the resource planner to see each person's workload week by week on the same timeline as the project, so you catch an overbooked consultant before you promise a start date you cannot staff.
Internal operations team running cross-department work
An initiative touches several teams, each with its own board. You use Scope to bring those boards into one Gantt view, set the dependencies that cross departments, and give leadership a single timeline that shows how a delay in one team pushes the others.
Dicas e boas práticas
Conselhos práticos para aproveitar melhor seu fluxo de trabalho
Set start and due dates to get the full Gantt picture
The more cards you add dates to, the more powerful your Gantt view becomes. Start with your key deliverables, then fill in supporting tasks to build a complete, accurate timeline.
Aumente e diminua o zoom para ajustar ao seu horizonte de planejamento
Switch between daily, weekly, and monthly views to see the detail you need. Use weekly view for sprint planning, monthly for roadmaps, and zoom out to share a high-level overview with stakeholders.
Group cards by label or member to organize your Gantt
Group cards in the Gantt to separate workstreams, phases, or team members. This makes it easy to see where each part of the project stands at a glance.
Export your Gantt to PDF to share with stakeholders
Use Placker's PDF export to share a clean Gantt with clients or leadership who don't have access, and pair it with Reports to add progress and workload views alongside the timeline you share.
Páginas relacionadas
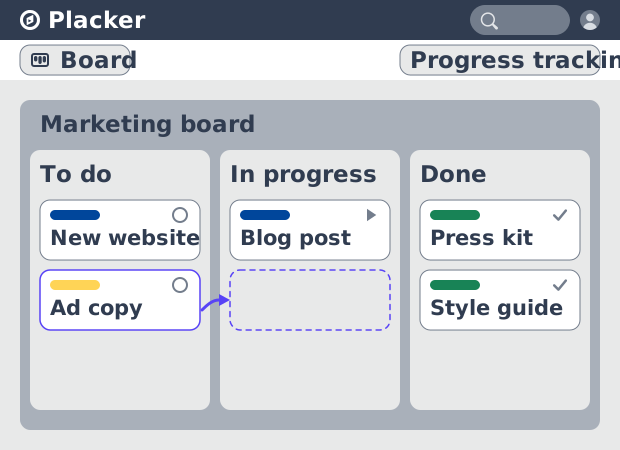
Visões de quadro: um quadro, qualquer visão
Veja seu trabalho como cartões que avançam pelas listas no Placker. Agrupe por membro, raia ou prazo e acompanhe o fluxo com relatórios Kanban.
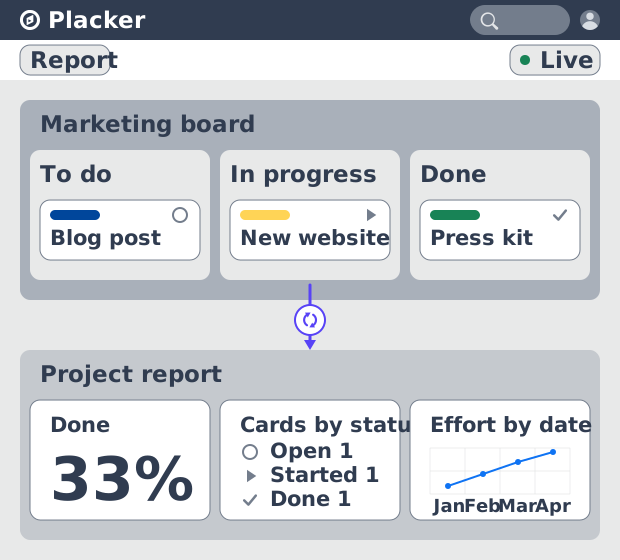
Dashboards e relatórios de projeto
Crie dashboards de projeto em tempo real: widgets KPI, tabelas dinâmicas, consolidações de portfólio e relatórios PDF agendados. Teste Placker grátis.
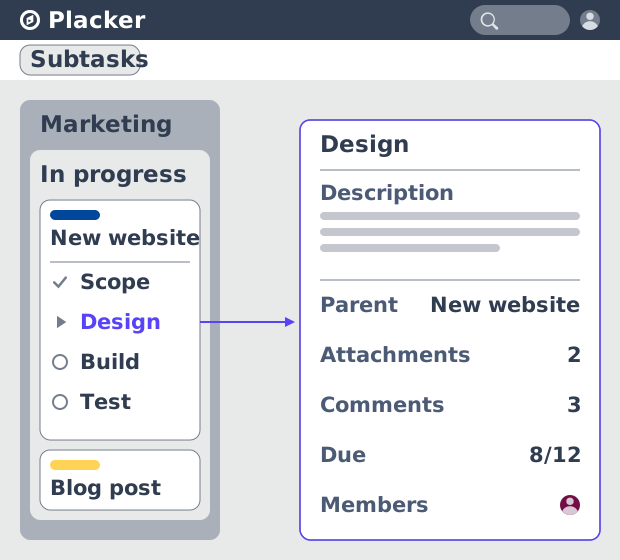
Parent-Child Cards in Placker | Subtasks that roll up
Parent-child cards in Placker give every subtask a full card and roll effort, dates and members up to the parent. Read the total on top.
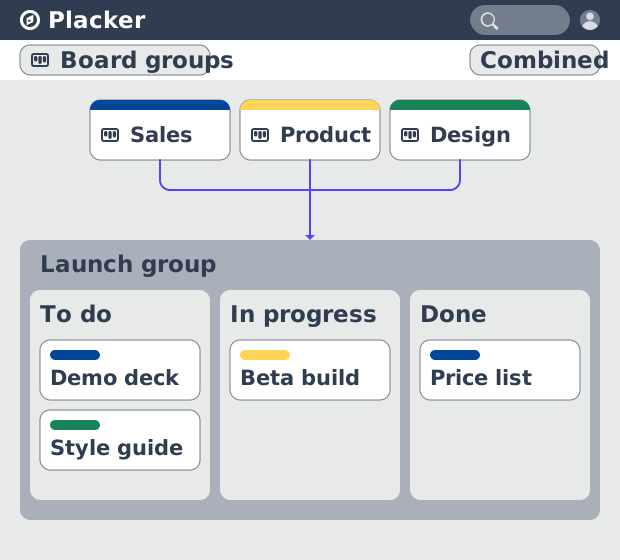
Grupos de Quadros: muitos quadros, gerenciados como um
Os Grupos de Quadros gerenciam muitos quadros como um só espaço: planeje, filtre e reporte em todos, e salve grupos reutilizáveis. Teste grátis.
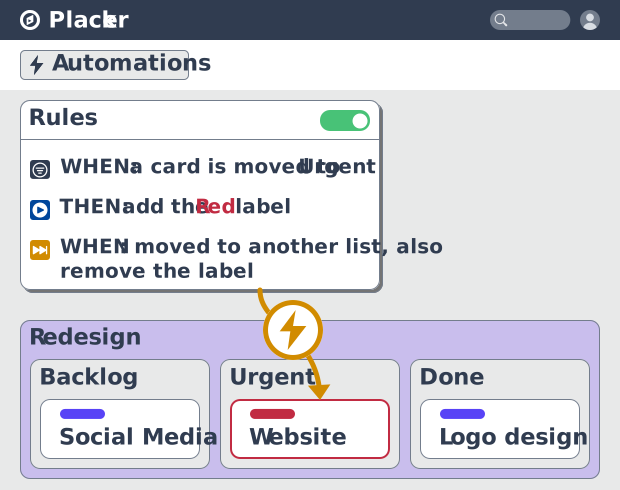
Regras de automação de quadros de projeto, no-code
Automatize quadros de projeto com regras condicionais. O Placker espelha, move, atribui e atualiza cartões conforme o trabalho muda. Veja como funciona.
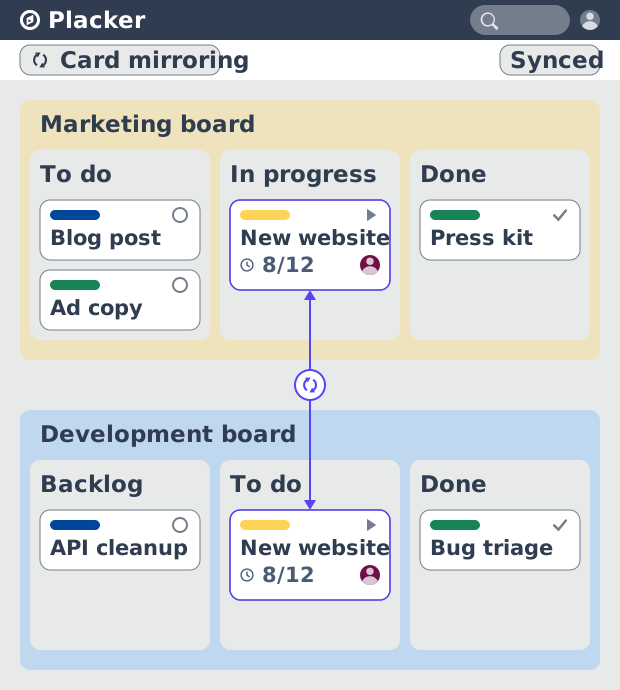
Card Mirror & sync in Placker: 2-way card sync
Card Mirror and sync keeps one task live across every Placker board. Edit a card once and status, dates and members update in seconds. Start a free trial.
Tudo pronto para começar?
Fácil de configurar, sem cartão de crédito. Comece seu teste hoje mesmo!